Oil and natural gas: Oil under strong bearish pressure
During this morning’s Asian trading session, the price of oil was in a slight bullish consolidation up to the $69.20 level
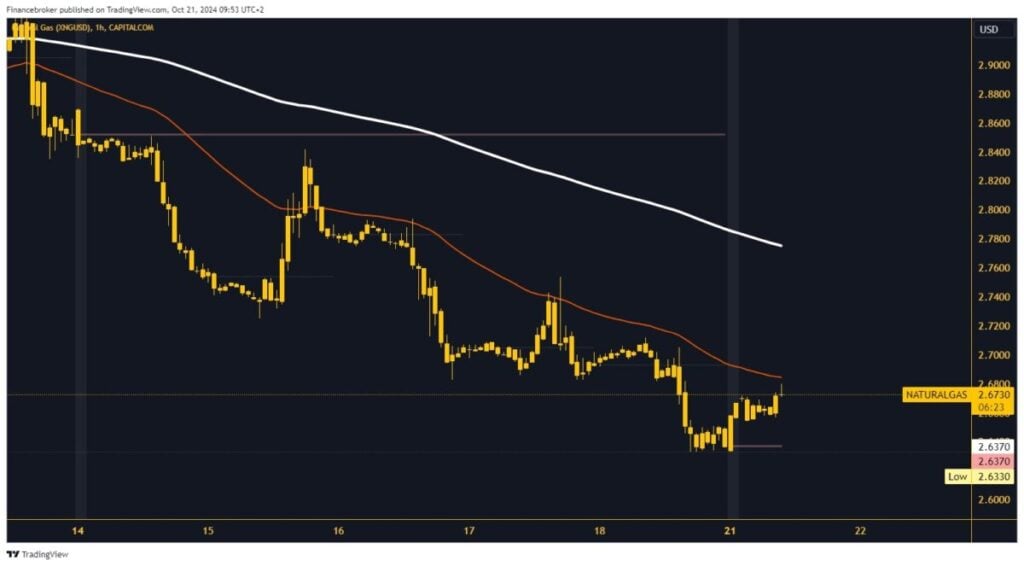
The price of natural gas fell to a new October low on Friday, October 18
Oil chart analysis
During this morning’s Asian trading session, the price of oil was in a slight bullish consolidation up to the $69.20 level. Before that, on Friday, October 18, the price fell to $68.17, a new two-week low. For now, we are seeing a recovery, but we are still in a bearish trend. The price would have to go back above $70.00 to get rid of some of the bearish pressure. If oil makes such a move, it will have a chance to initiate a bullish consolidation.
Potential higher targets are $71.00 and 72.004 levels. At $71.00, we will try to break the EMA 200 moving average. For a bearish option, we need a negative consolidation and a drop in oil prices below the $68.69 daily open level. With that step, we move to the bearish side, increasing pressure on the price to test last week’s low. Potential lower targets are $68.00 and $67.00 levels.
Natural gas chart analysis
The price of natural gas fell to a new October low on Friday, October 18. After that, in this morning’s Asian trading session, the price started a bullish consolidation up to the $2.68 level. In that zone, we encounter the EMA 50 moving average, which could be an obstacle to further continuation to the bullish side. If the price withstands the pressure at that level, we could see an impulse and a jump above the $2.70 level.
Potential higher targets are the $2.72 and $2.74 levels. For a bearish option, we need another negative consolidation and pullback down to the $6.40 support zone. Natural gas will again have to test the daily open level. This time, we need a break below and the formation of a new daily low. Potential lower targets are $2.62 and $2.60 levels.


