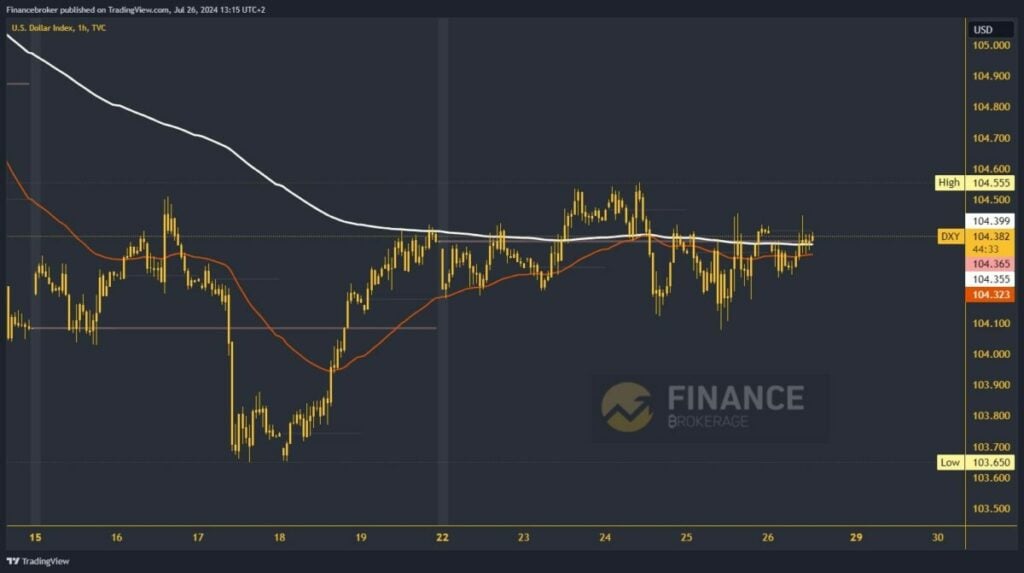
The dollar index remains positive at the end of the week
This week’s dollar index movement mainly occurred in the 104.20-104.50 range.
Dollar index chart analysis
This week’s dollar index movement mainly occurred in the 104.20-104.50 range. Yesterday, we had a short-term jump down to the 104.10 level, but we quickly returned to the previous rank. During this morning’s Asian session, the index first retreated to support at 104.25. After that, a bullish consolidation was initiated up to 104.38 levels. We have moved above the EMA 200 moving average and hope to stay there.
If we manage to maintain this momentum, we can anticipate a further bullish trend and a potential rise to the 104.50 level. We are currently within striking distance of the weekly high at 104.55 from Wednesday. A revisit to that level could trigger an upward surge to a new higher high. The 104.60 and 104.70 levels could be our next targets.
The dollar is trying to stabilize above the EMA 200 to get its support
For a bearish option on the dollar index, we need a break below the 104.20 level. This is where we slowly enter this week’s critical support zone. Holding too long could easily lead to an impulse below to a new weekly low. With that step, we will continue to the bearish side. Potential lower targets are 104.00 and 103.90 levels.
This morning’s Asian session brought news of the Tokyo Core CPI, which was in line with the forecast at 2.2%. The EU session was relatively quiet, and now our attention turns to the upcoming US session, where we will receive data on the Core PCE Price Index, Personal Spending, and Personal Income. The outcome of these reports could have a significant impact on the dollar index chart, making it a session not to be missed.


