Gold and silver: the price of gold successfully tested $2400
The price of silver during the Asian trading session was in the $30.55-$31.00 range.
Gold chart analysis
During this morning’s Asian trading session, we saw a pullback in the price of gold to the $2400 level. There, we also tested the EMA 50 moving average to see if it could provide support. For now, we managed to stay above and slightly recover to the $2408 level. A good move would be a return above the weekly open price of $2410. This brings us back to the positive side and increases the chances of seeing a return to the previous bullish trend.
Key price levels to watch in the gold chart analysis are the potential higher targets of $2420 and $2430, and the potential lower targets of $ 2385 and $ 2380. A bearish scenario would require a pullback below the EMA 50 and $2400, leading to increased pressure and a potential return to the previous low of $ 2390.
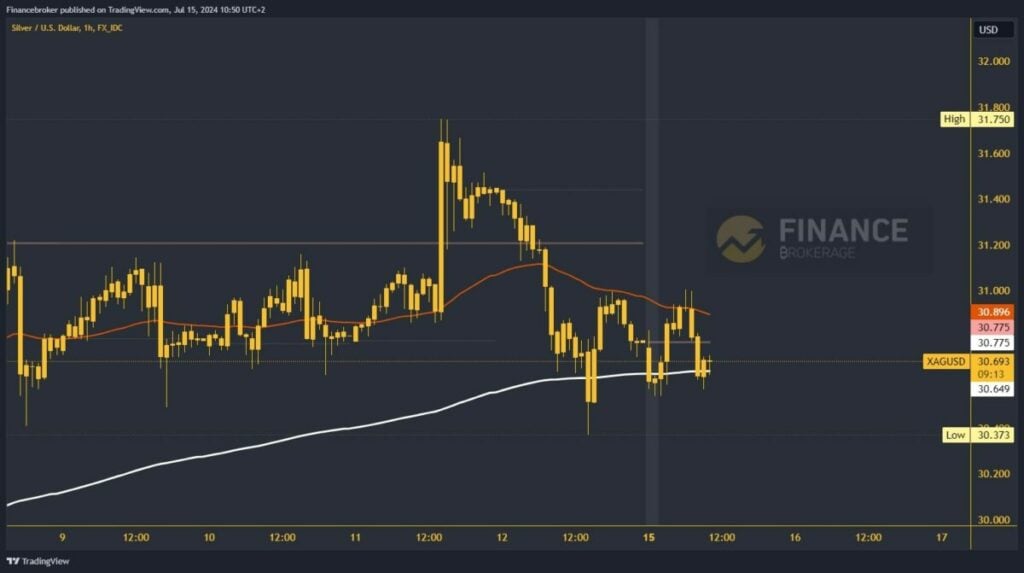
Silver chart analysis
The price of silver during the Asian trading session was in the $30.55-$31.00 range. We are now at $30.55 and testing support at the EMA 200 moving average. This morning, we were already at this level once. A revisit is generally a bad sign, which could cause the price of silver to go into retreat. With a drop below the EMA 200, we will initiate a bearish consolidation to a new weekly low. Potential lower targets are $30.40 and $30.20 levels.
For a bullish option, we need a positive consolidation and a jump in silver prices to the $31.00 level. There, we get new support on the EMA 50 moving average. After that, the price will have the opportunity to start a further recovery. Potential higher targets are the $31.20 and $31.40 levels.