The dollar index is bullish again from this morning
On Friday, October 18, we watched the dollar index pull back to the 103.50 level
Dollar index chart analysis
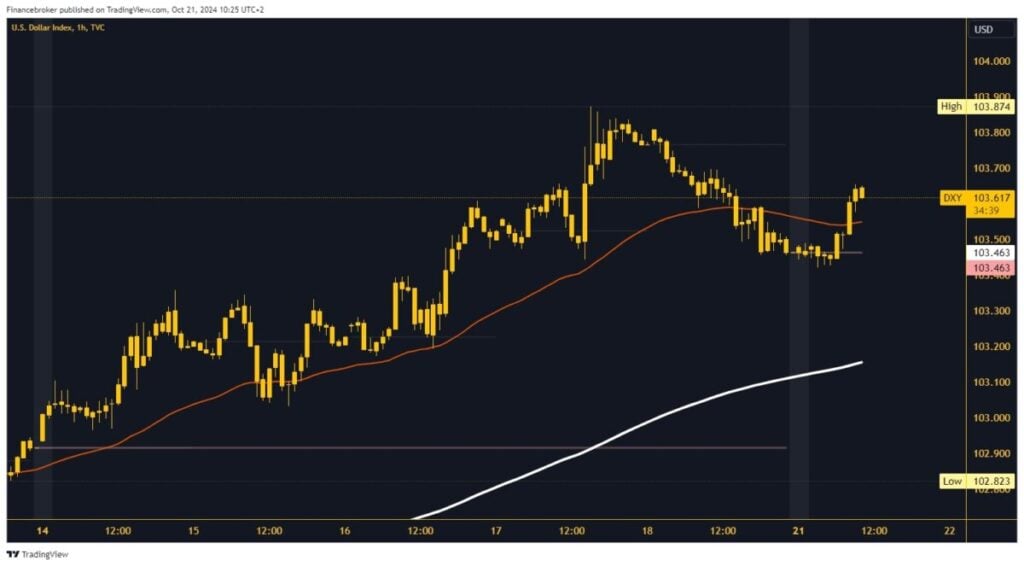
On Friday, October 18, we watched the dollar index pull back to the 103.50 level. Bearish consolidation was active throughout the day. Towards the end of the day, the index fell below the EMA 50 moving average, thus intensifying the bearish pressure. At the end of the day, we managed to stop at 103.50.
During this morning’s Asian trading session, the dollar index hit new support at 103.40. After a brief consolidation at the new low, we initiated a bullish consolidation again above 103.50 and the EMA 50 moving average. That reinforced the bullish momentum to 103.65 today’s high. The dollar looks very stable and confident to continue on the bullish side. Potential higher targets are 103.70 and 103.80 levels.
The index is recovering from Friday’s decline, moving back above the EMA 50 moving average
For a bearish option, we need a negative consolidation, a drop below the EMA 50 moving average, and a test of the daily open level. By descending into the support zone, we put pressure on the previous low. This time, we hope for a new break below and the formation of a new daily low. Potential lower targets are 103.30 and 103.20 levels. In the 103.20 zone, we encounter the EMA 200 moving average and expect the bearish momentum to slow down there.
We don’t have that much significant economic news on Monday and Tuesday. For today’s US session, we have the US Leading Index and FOMC Member Kashkari Speaks. From the news in the EU session, we single out the Germany Producer Price Index (PPI) for September. The published data is weaker than the forecast. The Producer Price Index (PPI) fell by -0.5%, while the forecast was -0.2%. This caused the euro to weaken, while the dollar index used it to its advantage and recovery.


