The dollar index is in a good position to remain bullish
Dollar index chart analysis
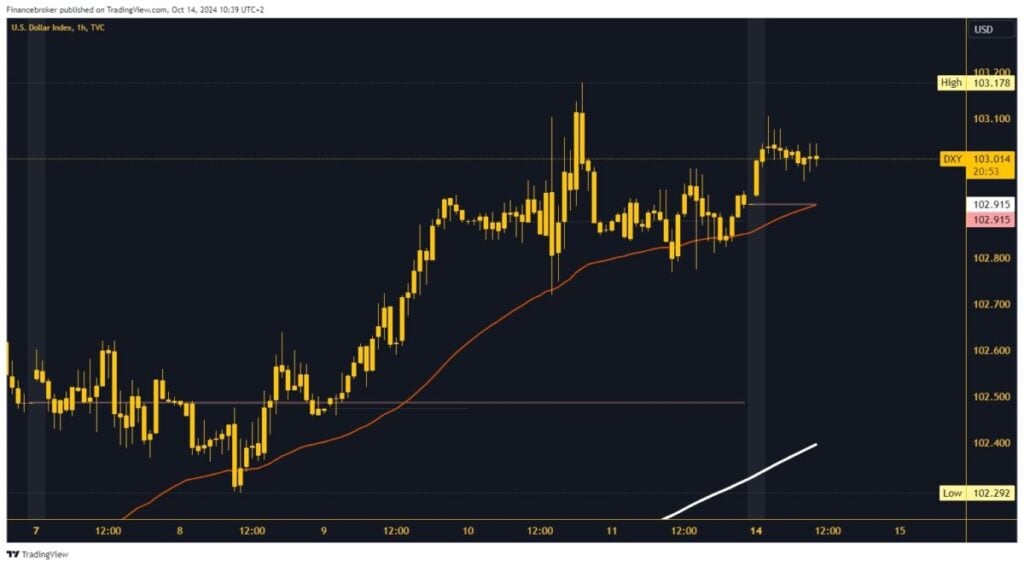
Last week, we saw the dollar index rise to 103.18, a new October high. Friday was marked by consolidation in the 102.80-103.00 range. While we were consolidating, the EMA 50 moving average approached us. This influenced us to see a bullish impulse up to 103.10 levels on Monday at the start of the Asian session. The dollar index continues to maintain above the 103.00 level for the rest of the day.
We do not rule out a pullback to the daily open level where we would test the EMA 50 moving average. There is a good chance that we will see a bullish consolidation in the US session and test this morning’s high. Potential higher targets are 103.10 and 103.20 levels.
The index sits at 103.00 in anticipation of a new bullish impulse
For a bearish option, the dollar index would have to close below the EMA 50 moving average and the daily open level. This moves us to a new daily low, and we will be under pressure to start a further pullback. The critical level is 102.80, and a pull below will further strengthen the bearish momentum. Potential lower targets are 102.70 and 102.60 levels. The EMA 200 moving average is far away at the 102.30 level.
On Monday and Tuesday, we don’t have that much significant economic news, but that’s why many geopolitical events could affect the movement of the dollar index. For Wednesday, we highlight the British CPI; forecasts announce a drop in inflation from 2.20% to 1.90%. Thursday is full of important economic news. We are starting from the Eurozone CPI, and a decrease in inflation is forecast here. After that, the European Central Bank will announce the future interest rate at the start of the US session. Expectations are that we could see a reduction in the interest rate from 3.65% to 3.40%. From the US news, we highlight Core Retail Sales, Initial Jobless Claims, the Philadelphia Fed Manufacturing Index, and Retail Sales.
[the_ad id=”24160″]


