Oil and Natural Gas: New Targets and Prices for this Week
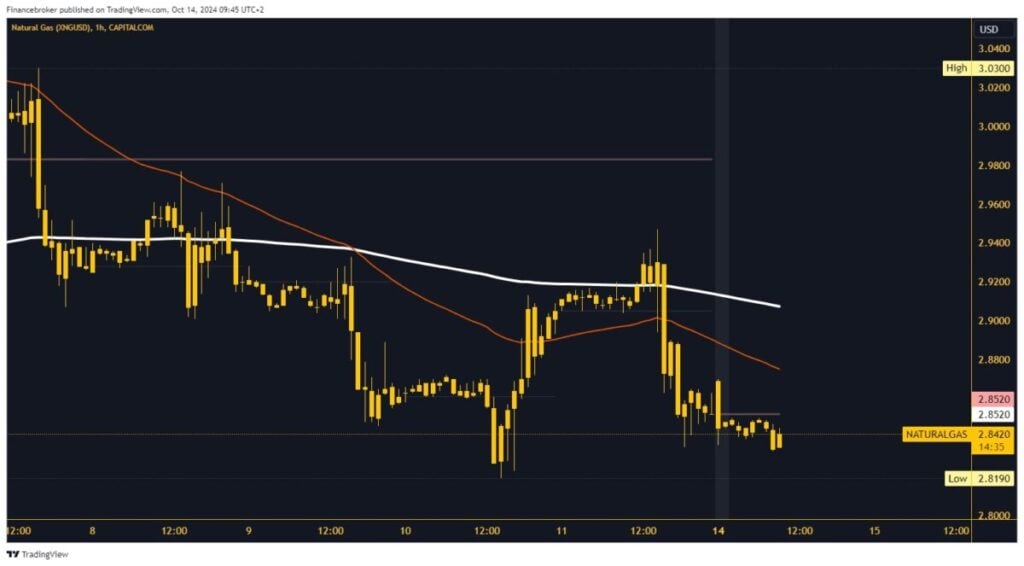
On Friday, the price of natural gas was under a lot of pressure in the $2.94 zone
Oil chart analysis
At the opening of this week’s session, the oil price was under pressure, and we saw a bearish gap between $75.56 and $75.00. We did not stop there but continued to pull down to the $74.10 level. After that, we managed to initiate a recovery that did not last long, and we find resistance at the $74.85 level. An additional break in the EMA 50 moving average in that zone had the effect of oil starting a retreat back to the $74.10 level.
Currently, the price is under pressure in the EU session, and we expect to see a further retreat and fall to a new daily low. We hope for support in the EMA 200 moving average in the zone of $73.50 levels. Potential lower targets are $73.00 and $72.50 levels. For a bullish option, we need a positive consolidation of the oil price above the $75.00 level. There, we expect to find support in the EMA 50 moving average. After that, the price has a chance to close this morning’s gap.
Natural gas chart analysis
On Friday, the price of natural gas was under a lot of pressure in the $2.94 zone. After losing the previous momentum, we saw the initiation of a bearish consolidation below the EMA 200 moving average. That strengthened the bearish momentum, and by the end of the market closing, the price dropped to the $2.84 level. During this morning’s Asian trading session, natural gas remained in the support zone without the strength to move above the $2.85 level.
The current picture is unfavorable for the price, and we can expect to start a new pullback to a new low. Potential lower targets are $2.82 and $2.80 levels. For a bullish option, we need a positive consolidation above the daily open level of $2.85. After stabilizing there, we can hope for a new positive consolidation and further recovery. Potential higher targets are $2.86 and $2.88 levels.
Commodity PricesNatural gasOil PricesOPEC
[the_ad id=”24160″]


