USDCHF and USDJPY: USDCHF is testing September support
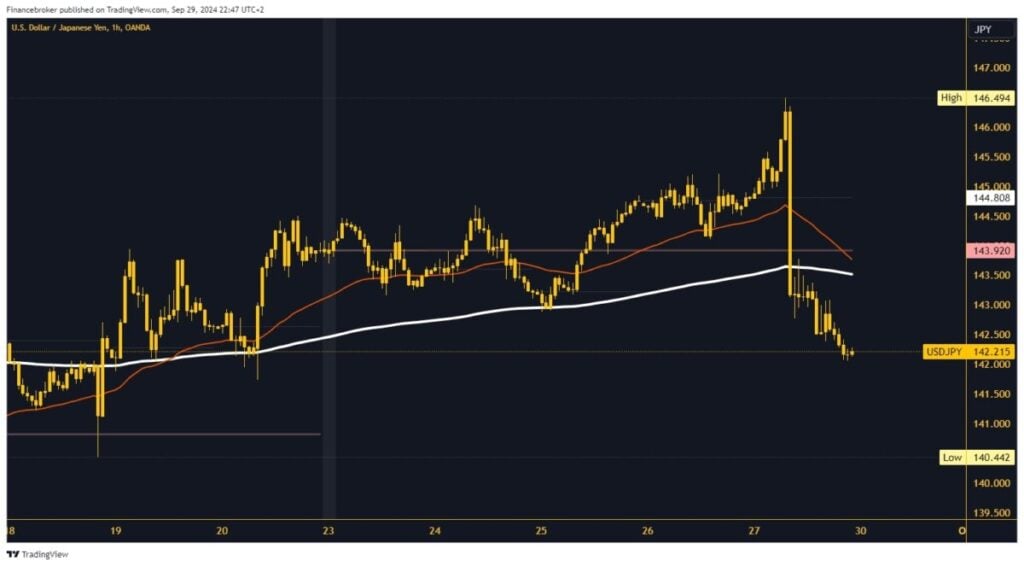
The movement of the USDJPY on Friday was very unpredictable
USDCHF chart analysis
The short-term recovery of USDCHF on Friday morning was stopped at the 0.84930 level. After stopping in that zone, the pair began to retreat to a new weekly low at 0.84000. We are in the zone of September support, and it could easily happen that we soon turn to the bullish side. Otherwise, we continue to pull back and form a new low. Potential lower targets are the 0.83800 and 0.83600 levels.
If the September support zone holds USDCHF, it will initiate a bullish consolidation. We expect the pair to stabilize above 0.84200 and continue its recovery. Retracement to 0.84600 level, we are back to the EMA 200 moving average and need a break above to get its support. After that, the chances of stabilizing on the bullish side increase. Potential higher targets are 0.84800 and 0.85000 levels.
USDJPY chart analysis
The movement of the USDJPY on Friday was very unpredictable. First, we saw a stable bullish consolidation, which reached a weekly high of 146.49. After that, a strong bearish impulse brought down the pair by 350 pips, bringing it down to the 143.00 level. We then saw further bearish consolidation to a new weekly low at the 142.00 level. On the same day, the pair formed a weekly high and low.
USDJPY could find new support and initiate a bullish consolidation on Monday. This would take us back above 143.00 and test the EMA 200 moving average. If the trend continues, we will see the pair at new levels on Monday. Potential higher targets are 143.50 and 144.00 levels. For a bearish scenario, we need a continuation of bearish consolidation and a breakout of the 142.00 level. This would confirm that USDJPY remains on the bearish side and will continue its retreat. Potential lower targets are 141.50 and 141.00 levels.


