S&P 500 and Nasdaq close to erasing last week’s losses
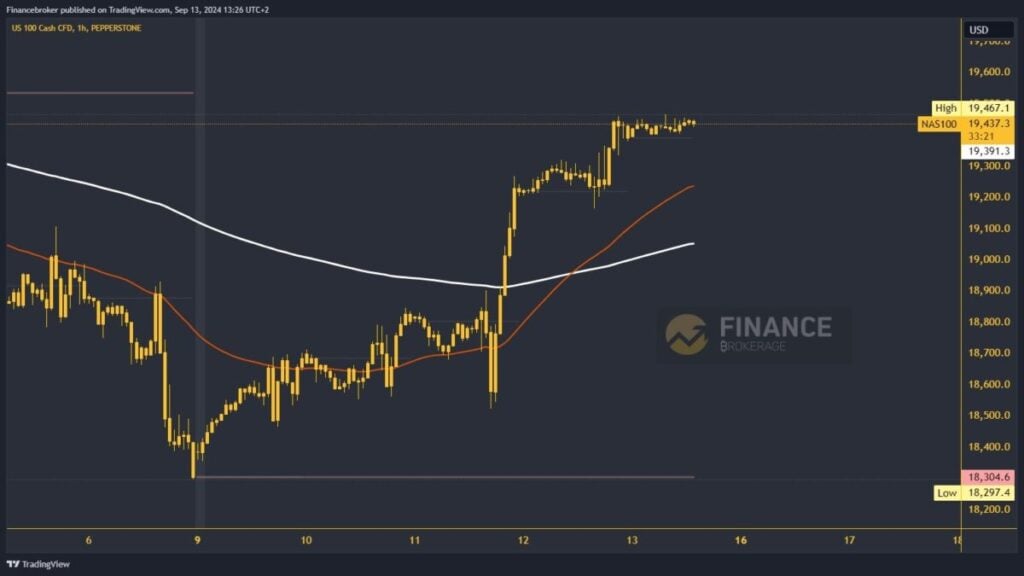
This morning, a strong bullish consolidation is pushing the Nasdaq to a weekly high of 19467.1
S&P 500 chart analysis
This week is quite bullish after watching the S&P 500 pull back last week. On Wednesday, we had a short-term pullback to the 5400.0 level. Soon after, we got support down there and initiated a recovery above the EMA 200 and 5500.0. We did not stop there but continued on the bullish side. During this morning’s Asian trading session, the index held above 5590.0. The S&P 500 continued to rise to 5610.0, forming a new weekly high there.
All indicators suggest that the index could continue its bullish growth. Potential higher targets are 5625.0 and 5650.0 levels. The index could drop below the daily open price of 5590.0 if momentum weakens. With that step, it moves to the negative side, where it will be under greater bearish pressure. Potential lower targets are 5575.0 and 5550.0 levels. The EMA 200 moving average is waiting for us in the 5550.0 zone.
Nasdaq chart analysis
This morning, a strong bullish consolidation is pushing the Nasdaq to a weekly high of 19467.1. From Monday to today, the index rose over 6.0%. On Wednesday, it received support from the EMA 50 and EMA 200 moving averages, which only reinforced the bullish scenario. During the Asian trading session, the Nasdaq moved in the 19400.0-19460.0 range. There were no changes in the EU session either, and only in the US session do we expect greater index volatility.
We need momentum above this level to climb to a new weekly high. Potential higher targets are 19500.0 and 19600.0 levels. If, by any chance, we see a drop below the daily open price, it would signal the beginning of a bearish consolidation. After that, the bearish momentum grows, and the Nasdaq index retreats further. Potential lower targets are 19300.0 and 19200.0 levels.


