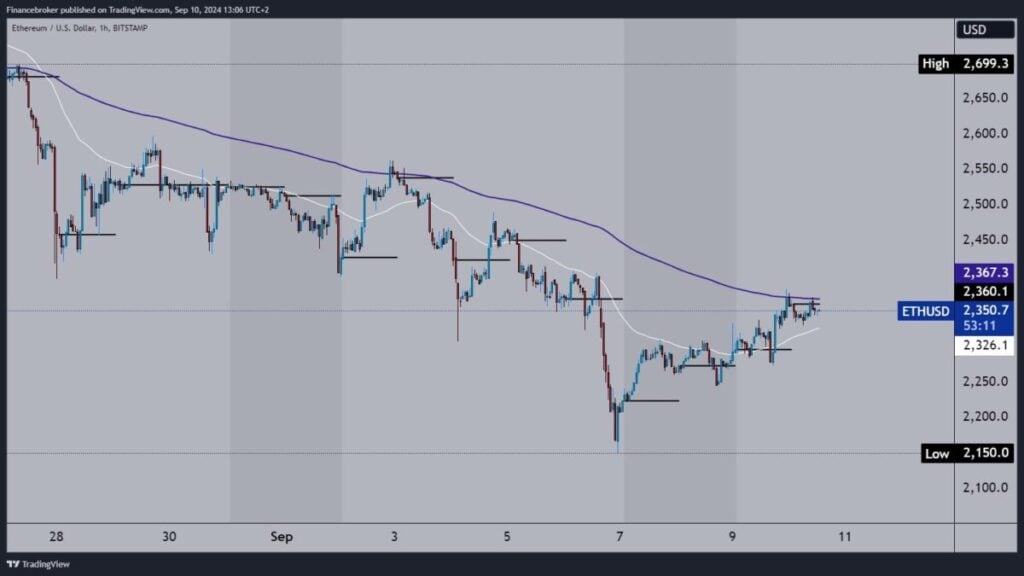
Ethereum is waiting for a breakthrough above the EMA 200
Ethereum’s price found new support on Monday at the $2275 level
Ethereum chart analysis
Ethereum’s price found new support on Monday at the $2275 level. Soon after, we saw a strong bullish impulse and a jump above the $2300 level. The main center of gravity of the price has moved up to the $2350 level. So last night, we saw the formation of a weekly high at $2380. There, we met the EMA 200 moving average, which stopped further progress to the bullish side.
This caused Ethereum to hold below this morning. A few hours ago, we had a new test of the EMA 200, which still does not allow us to move above. The price is at the $2350 level, and a stronger impulse is needed to get rid of the moving average’s resistance. His support would mean a lot to us for further recovery to the bullish side.
Price has a barrier at the EMA 200 moving average and is holding below it
It’s crucial to keep an eye on the EMA 200 moving average, as the price is currently held below it. Potential higher targets are the $2400 and $2450 levels. However, a bearish option could come into play if we see a negative consolidation and a pullback of the Ethereum price below $2325 and the EMA 50 moving average. This would indicate a new daily low and confirm bearish pressure, prompting a further pullback to the weekly support at $2275.
With the continuation of the new bearish momentum, Ethereum will be forced to create a new weekly low and test the weekend support zone. Potential lower targets are the $2250 and $2200 levels. Too strong bearish pressure could push us to test last week’s low at the $2150 level.


