Trading Chart Patterns: A Comprehensive Guide
Table of Contents
Trading has become significantly easier with the development of various computational tools and features, including chart patterns. If you’re an experienced trader, you’ve likely heard of them, as trading chart patterns are among the most widely used tools in the market. These patterns are valuable for both novice and seasoned investors, often relied upon by market participants to accurately identify stock price trends and determine the optimal times for buying, selling, or holding. Indeed, patterns can reveal all of this, but only if you know how to interpret them correctly.
Stock chart patterns can become vitally important trading tools if traders devise correct trading strategies. They will help you find market trends and predict stock price movements. Besides, you can use them for determining the value of various assets, including stocks, forex, commodities and more. There are more than 75 chart patterns floating on the market. While it might seem a bit overwhelming, you can start learning with basic ones and add others to your repertoire gradually.
Besides, some traders use several chart patterns and still profit handsomely. It all comes down to your chart pattern trading strategy. Usually, traders determine their preferred pattern based on their methods and goals: if something works well for you, go for it.
Three Main Groups of Chart Patterns in Trading
While many patterns exist, they are often classified into three main groups. These are continuation, reversal, and bilateral. However, this classification often depends on the traders’ perspective. Some unite descending, ascending, and symmetrical triangles in bilateral pattern groups, while others think only symmetrical triangles belong to that group.
Patterns often show transitions between falling and rising trends. A price pattern signals price movement by using various curves and trendlines. Thanks to the latter, traders can spot support and resistance levels on a chart. Trendlines are straight lines on a chart connected with ascending lows or descending highs. If they go up, that means the price rises, and if they go down, the stock falls.
The candle bar’s body often shows the majority of price action. Also, we often see closing prices on daily charts instead of highs or lows. That’s because closing prices show the figure the investors are willing to hold overnight.
If you encounter uptrend chart patterns in trading, the price is climbing. In such patterns, trendlines usually show support levels below the specific price. They also connect at least two or three low points.
On the other hand, we have downtrends when the chart shows lower highs and lower lows. But unlike uptrend charts, they connect at least two of the highs. Besides, they must signal some resistance levels above the current price. A sideways market, also known as consolidation, occurs when the price fluctuates between two parallel trendlines, which are often horizontal.
Let’s examine the most common stock trading patterns that every trader should know about.
The Most Common Trading chart patterns
Continuation Patterns
This price pattern shows the existing trend is temporarily paused, but it’s only a short pause, meaning that the traders are resting or revising their strategy. Still, until the pattern forms fully, there’s no way to determine whether the price goes up or down. So, you should pay attention to the trendlines and how they are drawn. Analysts advise assuming that the price pattern continues until the chart shows it’s reversing. If the price pattern takes too long to develop, that means you should expect larger price movements.
There are several kinds of continuation patterns, including:
Pennants: These are drawn by using two converging trendlines
Flags: They consist of two parallel trendlines
Wedge patterns: Drawn with two trendlines, both angled either up or down so that they would converge if they were long enough
Triangle Patterns
Triangles occur more often than other patterns; consequently, they are among the most popular ones. Three types dominate the charts:
Ascending Triangles: This pattern is characterized by a horizontal line along the swing highs and a trendline with an upward trajectory along the swing lows. These two lines form a triangle on the chart
Symmetrical Triangles: This chart pattern appears when the asset’s price consolidates. It features two converging trend lines with opposite slopes. In this pattern, the breakout and breakdown targets are equidistant from the initial low and high of the breakout and breakdown points
Descending Triangles: This is typically a bearish pattern, but in some cases, it might indicate bullish activity. This occurs if it doesn’t show a breakout in the opposite direction
Triangle patterns can continue for weeks or even several months.
Reversal Patterns
Reversal patterns signal that the trend is changing. Usually, they appear when bulls or bears change direction or stop trading. The ongoing trend will pause, and then the trendline will continue in a new direction.
Sometimes investors are selling some assets more enthusiastically than others are buying. In such cases, we get distribution patterns. However, when the reverse is true, we see accumulation patterns. Again, we should expect a larger move after the price breaks out if it takes longer to develop the pattern and the price movement inside it is also larger.
The most common reverse patterns are:
Double Tops: These patterns reflect a short-term high spike followed by a failed attempt to break above the resistance level
Head and Shoulders: This pattern shows one larger movement flanked by two smaller price movements
Double Bottoms: These occur when a short-term drop is followed by an unsuccessful attempt to break below the support level
Other Considerations
You might also come across Gaps. These reversal patterns occur when we have some space between two trading periods. Usually, this is due to a significant spike or downtrend in price. Traders identify three main gap pattern types:
Breakaway Gaps: These gaps form at the beginning of a trend
Runaway Gaps: These occur when the trend is at its midpoint
Exhaustion Gaps: These gaps appear at the end of a trend
What About the Advanced Chart Patterns?
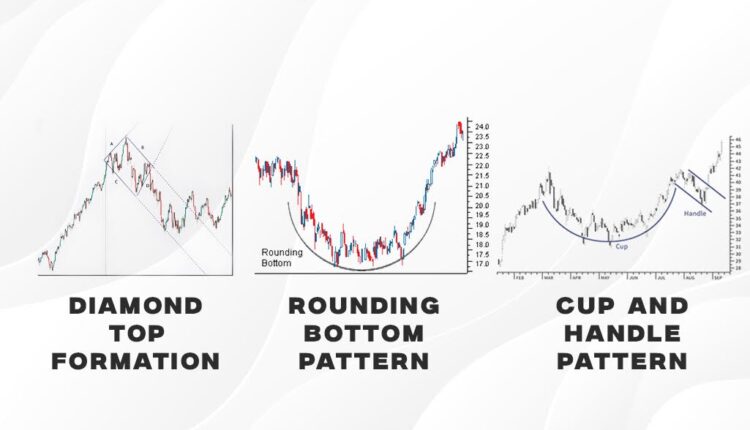
We have already reviewed the most common chart patterns. Let’s move on to the more advanced ones. You might have heard about cup and handle price patterns, as investors discuss them often.
This pattern resembles a cup with a handle, that’s where it takes its name from. The cup has a “U” shape, while the handle has a downward trajectory.
Cup and handle price patterns signal a bullish activity, but the right side of the pattern usually indicates lower trading volume. Sometimes, it takes only seven weeks to form, while other times, it might take up to 65-66 weeks.
Investors use a cup and handle patterns to spot buying opportunities. In some cases, they can determine long-term bullish trends, as well. However, that mostly depends on the type of asset and market sentiment.
A Rounding Bottom
A Rounding Bottom is another advanced chart pattern useful for investors. It resembles the cap and handle pattern but without the handle. A rounding bottom pattern is a series of price movements that form a “U” shape graphically. They usually appear at the end of the long-term bearish trends and indicate the price reversal.
Furthermore, this pattern might continue for several weeks or even months. It occurs seldom compared to other patterns, though. It might be considered a bullish pattern, as usually, it indicates that the asset’s price will increase soon.
In the rounding bottom pattern, the trading volume perfectly follows the asset price’s directions. When there is an excess supply of the shares, the stock’s price falls. However, investors start buying it at a lower price and with the increase in demand, the price also rises. Consequently, the stock passes the resistance line and after breaking out, continues its uptrend trajectory until it comes up the next resistance line. That’s where the rounding bottom pattern ends.
A Diamond Top Formation Pattern
Diamond Top, a technical analysis pattern, occurs when the stock changes its uptrend trajectory. It indicates that the price will move in bearish territory. Trend reversal is common on the market, so you will frequently come across this bearish pattern.
In this pattern, trendlines connecting the highs and lows form the diamond shape. That’s why we call it a diamond top pattern.
What Is the Moving Average (MA) And How Can You Use It?
The Moving Average (MA) is a great tool for technical analysis. It gives investors an average asset price, so you can compare it to the current price and determine whether the stock is overpriced or undervalued.
The MA calculates the average using data from a specific period, like 20 minutes, 10 days, 30 weeks and so on. Traders can also select the period they are interested in and see the results.
Furthermore, you can use various MA strategies and tailor them to your trading goals. This tool is useful for both short and long-term investors. Traders mostly use it for identifying the trend direction. It can also help you to spot resistance and support levels in the patterns.
The moving average convergence divergence (MACD) is another useful tool based on MA.
The direction of a moving average signals the trajectory of the price. If its angle is up, then the price is soaring, but if it’s angled down, the price is plummeting. When an MA moves sideways, the asset’s price is most likely in a range.
Sometimes, an MA replaces support or resistance for the stock. For example, when the asset trades in a bullish territory, its 50-day or 100-day MAs might act as its support level. On the other hand, if the stock is on a bearish territory, a moving average acts as a resistance level. But that’s not always the case.
Overall, if the stock price is higher than a moving average, it is experiencing an uptrend. But, if the price is below MA, we have a downtrend. You should consider, though, that MAs have different lengths, so you shouldn’t determine the trend solely based on their length.
Which Types of Moving Averages are the Most Common?
There are several types of Moving Averages. Traders calculate them in different ways based on their length and trajectory. SMA, or a five-day simple moving average, calculates the average price by adding the last five day’s closing prices.
EMA, or the exponential moving average, is also quite popular. Its calculation is also more complicated. However, compared to SMA, it reacts more quickly when the price changes.
Usually, various trading platforms have tools to calculate the moving averages, so you don’t need to do manual math. Both SMA and EMA are very useful in their own ways. You often have to decide which one to use based on the specific trade.
Trading Psychology – How to Avoid Making Mistakes While Reading Patterns
Did you know that there is trading and investment psychology? And when you use chart patterns, you need to consider how they can influence your trading decisions. As it happens, traders often succumb to cognitive and emotional biases that might negatively affect their investing experience.
Most traders have heard about FOMO or the fear of missing out, but it’s only the tip of the iceberg. It would be best to learn more about trading psychology to avoid making mistakes that cost you lots of money.
The most common mistake traders make is buying the stock with the influence of FOMO or succumbing to herd behaviour. The latter means that investors buy something solely because the majority buy it. However, this asset might not prove so profitable in the long run.
So, you need to make informed decisions instead of taking hasty steps. Don’t buy the asset if you aren’t sure about its worth, even if the chart patterns indicate it as a strong buy.
Being human means that numerous factors influence us, and it’s not always easy to act level-headed. Sometimes, the temptation is too strong. But if you want to achieve success, you need to learn how to manage these impulses and make consistent and objective trading decisions.
Learn How To Read The Chart Patterns For Successful Trading
We described only a small part of the trading chart patterns, but they will help you to make headways in the complex trading world. Remember, we often come across price patterns when the price consolidates. Thus, you can expect either a continuation or reversal of the trend. To guess the correct direction, you should closely observe trendlines, they will help you to identify the patterns correctly.
Trading volume is also an important indicator. It often declines when the pattern is forming, but volume also increases when the price breaks out of the pattern.
Overall, chart patterns offer invaluable insights for trading. If you want to learn more about the financial world and types of chart patterns, stay tuned for more of our educational articles!