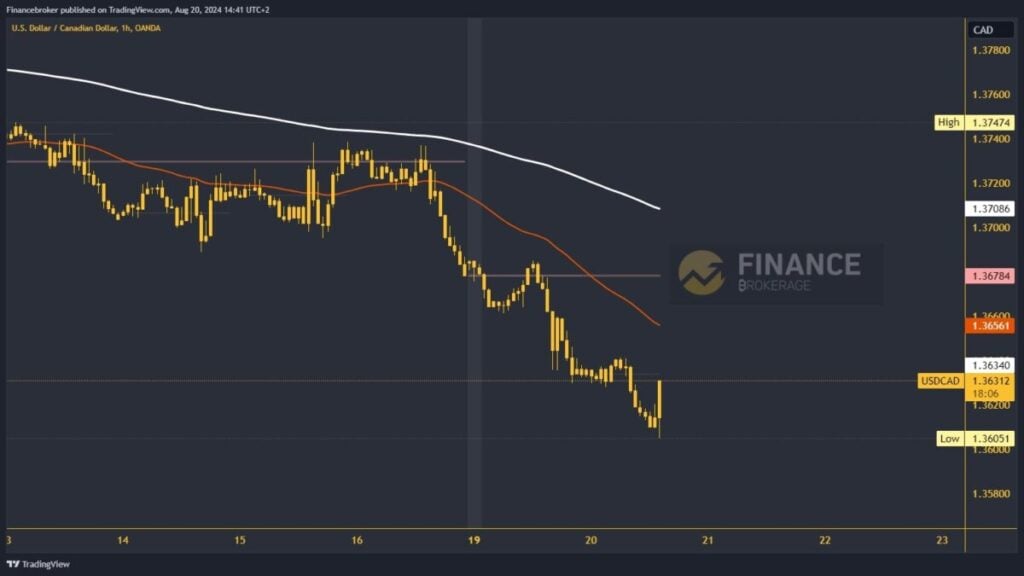
USDCAD and USDCNH: USDCAD is falling below last week’s low
During this morning’s Asian session, USDCNH fell to a new weekly low at 7.12000 level
USDCAD chart analysis
This week, USDCAD continued to retreat to new lower levels. During this morning’s Asian session, the pair made a breakthrough below the 1.36200 level. This led to the formation of a new weekly low at 1.36050. Now, we see a bullish impulse stopping this pullback and trying to break away from the bearish embrace. We are currently at 1.36280 and trying to get back above 1.36400 above the daily open price.
If we manage to get back above, the chances of us starting a bullish recovery increase. Potential higher targets are 1.36600 and 1.36800 levels. We need a negative consolidation and a return to the previous low for a bearish option. A new visit to that level will strengthen the bearish momentum zsa continuation to the bearish side. Potential lower targets are 1.36000 and 1.35800 levels.
USDCNH chart analysis
During this morning’s Asian session, USDCNH fell to a new weekly low at 7.12000 level. Soon after, the pair recovered to the 7.14500 level. There, it met the EMA 50 moving average, which stopped further recovery. Below, we have seen consolidation, and now we are close to testing the EMA 50 again. This time, a break above could form a new weekly high.
Potential higher targets are 7.15000 and 7.15500 levels. The EMA 200 moving average is in the weekly open price zone of 7.16200. For a bearish option, USDCNH would have to pull back below the 7.13000 level. With that step, we descend below the support zone and the chance to continue pulling to the bearish side increases. Potential lower targets are 7.12500 and 7.12000 levels.


