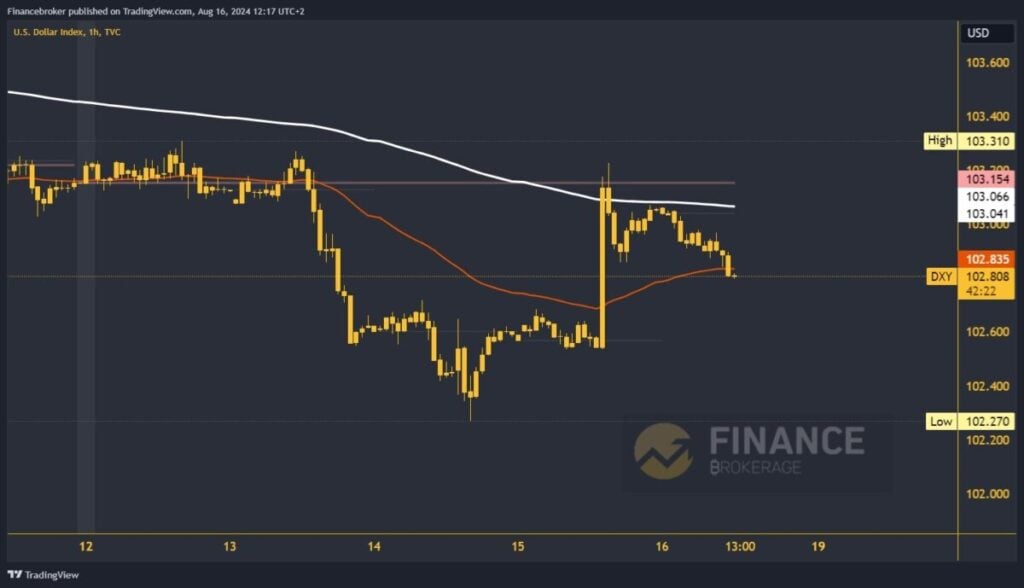
The dollar index is encountering resistance this morning
Yesterday, the dollar index attempted to move above the weekly open price and the EMA 200 moving average
For a bullish option, the index must initially hold above the EMA 50 moving average
Dollar index chart analysis
Yesterday, the dollar index attempted to move above the weekly open price and the EMA 200 moving average. After waiting for a pullback to be initiated, a daily high was formed at 103.25. During this morning’s Asian session, the index fell below 103.00, increasing the pressure on the dollar. We are now at the 102.80 level and will try to test the EMA 50 moving average.
Bearish momentum has been in place since this morning and could continue to push the dollar to lower levels by the end of the day. Potential lower targets are 102.60 and 102.40 levels. By falling below 102.60, we descend to yesterday’s support and put pressure on the index to visit the weekly low at 102.27.
Can we expect a further retreat of the dollar next week as well?
For a bullish option, the index must initially hold above the EMA 50 moving average. If it achieves this, it will have a new position from which it could initiate bullish consolidation and recovery to higher levels. Potential higher targets are 103.00 and 103.20 levels. With the jump to 103.20, we pass above the EMA 200 and the weekly open price, which significantly reduces the pressure on the dollar index, strengthening the bullish momentum.
Today, we have no significant news from the market. There will also be less volume of strong economic news next week. For Tuesday, we highlight the Eurozone CPI. Economists’ forecasts are that there could be a slight increase in inflation from 2.5% to 2.6%. On Wednesday, we have Crude Oil Inventories and FOMC Meeting Minutes. It will be interesting to see what the Fed has to announce.


