Solana and Cardano: Solana fails to stay on the bullish side
On Sunday, the price of Cardano once again moved back below the EMA 200 moving average.
Solana chart analysis
The price of Solana is in retreat after it rose to $163.70 on Friday. Over the weekend, the price tried to hold above $152.00 but was unsuccessful in doing so. By falling below, we also went below the EMA 200 moving average, which strengthened the bearish momentum to the $141.50 level. On Monday, Solana managed to stabilize there and recover to $150.00. There, we met the EMA 200 again and again failed to move above its line.
Today’s movement takes place in the $143.00-$148.00 range. Soon, we could see a new impulse that indicates the future trend. A return above $152.00 opens the door to the bullish side. After that, we would have to stabilize there before starting further growth to the bullish side. Potential higher targets are the $154.00 and $156.00 levels.
Cardano chart analysis
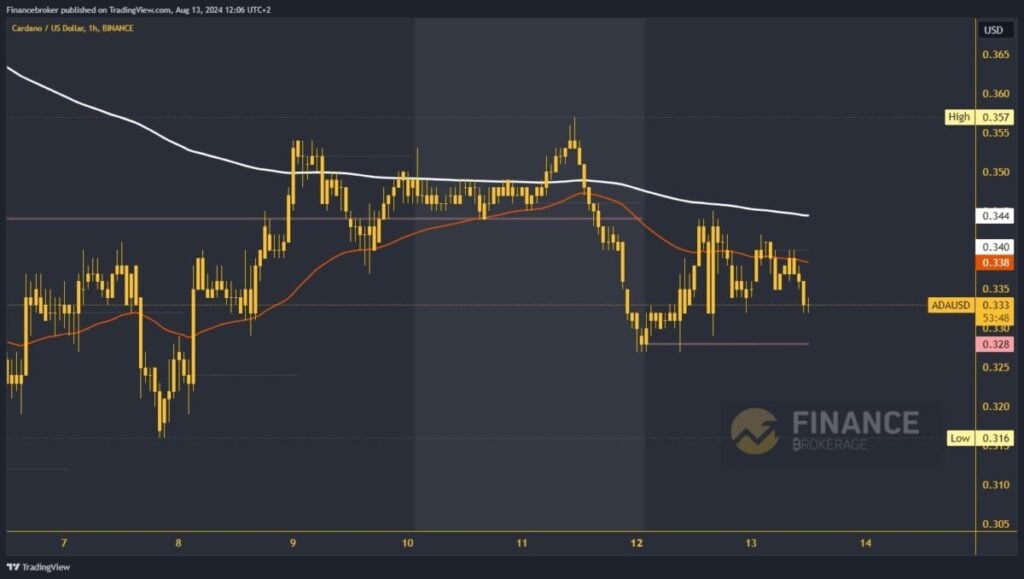
On Sunday, the price of Cardano once again moved back below the EMA 200 moving average. Before that, we had an attempt at bullish consolidation on Saturday to the 0.357 level. The inability to continue on the bullish side triggered a bearish consolidation to 0.327. On Monday, we managed to stabilize. We saw a new recovery attempt, which was stopped at the 0.345 level. With the 200 EMA pressure from the upside, we did not have enough strength to move above.
Cardano started to pull back again and fell to the 0.333 level today. Pressure is growing, and we expect further pullback and the formation of a new daily low. Potential lower targets are the 0.330 and 0.325 levels. For a bullish option, we need a positive consolidation and a jump to the 0.345 level. Then, we need to stabilize there if we want EMA 200 moving average support. Potential higher targets are the 0.350 and 0.355 levels.


