Solana and Cardano: Solana climbs to three-month high
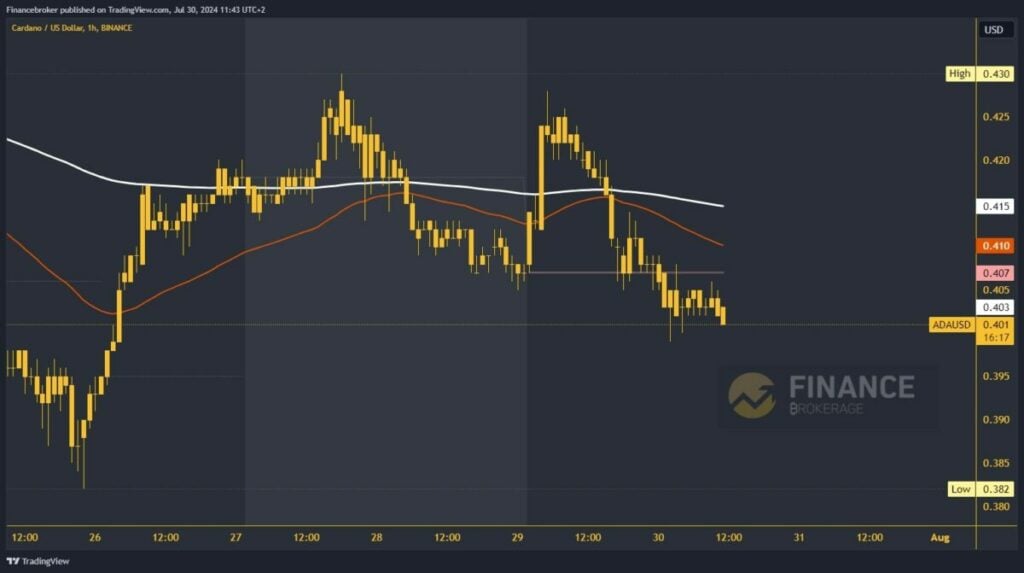
Cardano’s price is losing momentum after forming yesterday’s high at the 0.428 level.
Solana chart analysis
On Monday, the price of Solana rose to $193.89, forming a new three-month high. We didn’t have the strength to go on, but we saw a retreat from that zone. By the end of the day, the price retreated below $184.00, thus falling below the weekly open price. This further reinforced the bearish picture, continuing the pullback this morning to the $180.00 level. Here, we met the EMA 200 moving average and managed to hold now in this zone.
If the support is not enough, we move below to a new weekly low. Potential lower targets are the $178.00 and $176.00 levels. For a bullish option, we need a positive consolidation of the Solana price above the $185.00 level. There, we get new support in the EMA 50 moving average. After that, bullish momentum strengthens for further continuation to the bullish side. Potential higher targets are the $188.00 and $190.00 levels.
Cardano chart analysis
Cardano’s price is losing momentum after forming yesterday’s high at the 0.428 level. This led to the initiation of a bearish consolidation and pullback below the EMA 200 and 0.415. It is not the end; we saw a decline from the weekly open price last night. Intense pressure on Cardano continued to push it today to the 0.400 level, where we formed a weekly low. After a short consolidation in that zone for the last two hours, we see new pressure on the price that could give rise to a new bearish impulse.
Potential lower targets are the 0.395 and 0.390 levels. For a bullish option, we need a return above the weekly open price. With that, we are again moving to the bullish side above the 0.410 level. We also get support from the EMA 200 moving average, which could have a positive effect on the continuation of the trend. Potential higher targets are the 0.415 and 0.420 levels.


