The price of Bitcoin is trying to hold above moving average
Bitcoin chart analysis
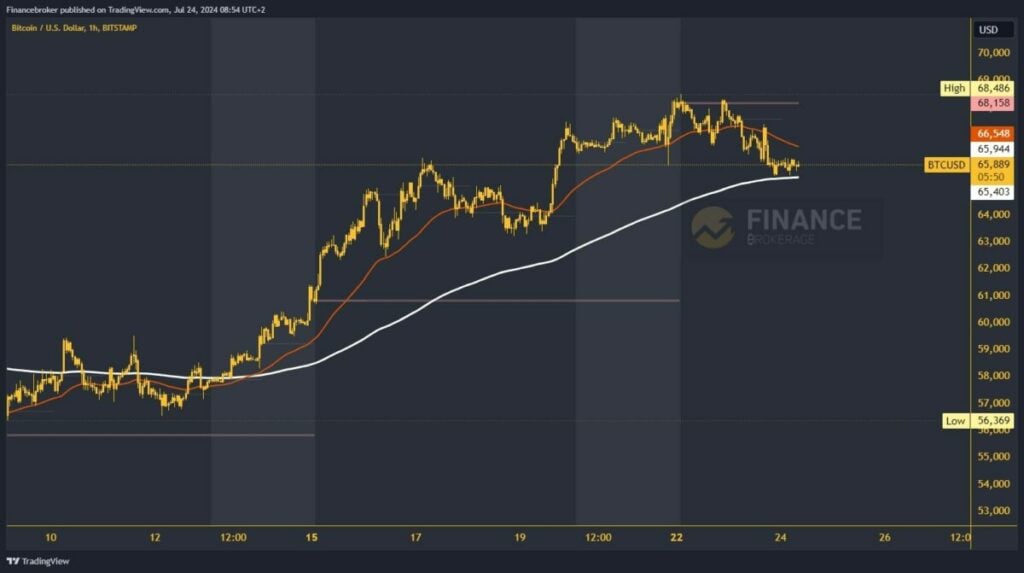
Bitcoin’s price has been undergoing a slight bearish consolidation over the past two days. We are gradually moving away from the previous high at $68486. Last night, a pullback to the $65450 level was observed. In this zone, the price intersected with the EMA 200 moving average, which currently provides support. The current price movement is confined within the $65450-$66100 range. Despite being at the EMA 200, we are still within the pressure zone.
This could potentially lead to a bearish impulse and a drop below the moving average line. Subsequently, we could anticipate a test of the $65000 level. If Bitcoin falls below the 200 EMA, it could face increased pressure for a deeper pullback. The $64,000 and $63,000 levels could serve as potential lower targets, with the $ 63,000 level possibly becoming the next major support.
Bitcoin is holding above the 200 EMA in hopes of triggering a recovery.
For a bullish option, we need to initiate a bullish consolidation above $66000. This level is crucial. At $66500, we will meet the EMA 50 moving average. With the new support, we expect a strengthening of the bullish momentum and a continuation of further growth to higher levels. The previous high was formed yesterday at $67400, and we need a test of it and a break above.
If Bitcoin secures that, it will have enough momentum to climb up to the weekly open price of $68,158. By moving above this line, the price returns to the positive side, which should encourage us to look towards higher levels. Potential higher targets are the $69,000 and $70,000 levels.


