The price of Bitcoin continued last week’s bullish trend
Bitcoin chart analysis
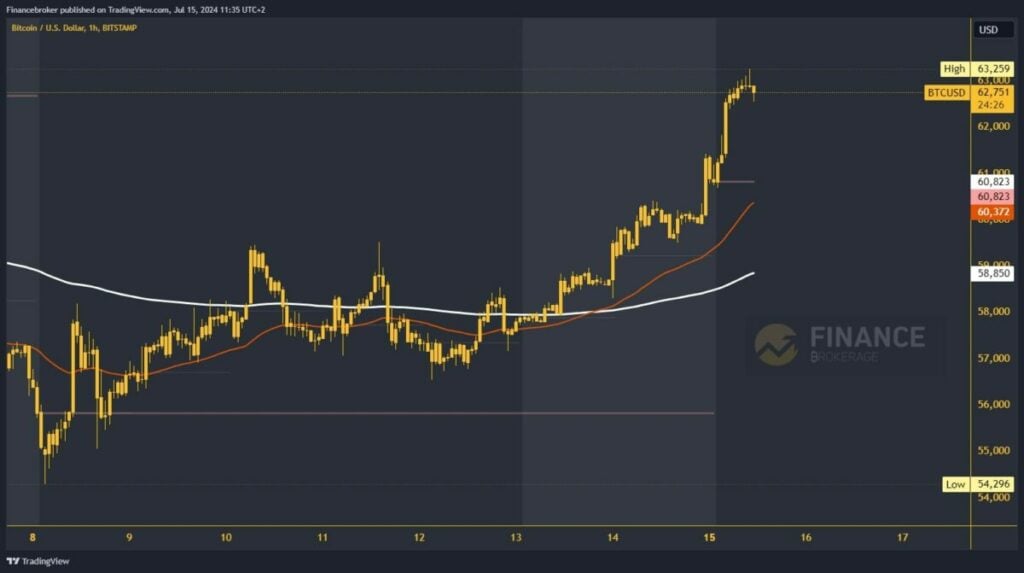
In the previous hour, we witnessed a promising turn of events in the Bitcoin market. The price surged to a new high at the $63259 level, a level we hadn’t seen in thirteen days. More importantly, the price managed to reclaim its position above the EMA200 moving average, a move that injected a dose of optimism into the market. By the end of the day, we observed a recovery to the $59,000 level, further bolstering the positive sentiment.
Bitcoin prices continued to rise above $60,000 on Sunday. A new high was formed at the $61450 level. After that, on Monday morning, we first saw consolidation and retests at the $60,800 level. From this level of support, a positive consolidation was initiated, and a jump to the weekly high was seen. In this hour, we see a pullback to the $62600 level.
Bitcoin price is back on the bullish side; is there any strength to go higher?
There was a decrease in the bullish momentum, and the price began to retreat. It is easily possible to see a descent and testing of the $62000 level. By doing so, we would move away significantly and strengthen the bearish momentum. Bitcoin would be forced into further retreat. Potential lower targets are the $61500 and $61000 levels. We are here at the weekly open price and will try to stay above it on the positive side.
The next support is the EMA 50 in the zone of $60400. For a bullish option, we need a positive consolidation and a return above the $63000 level. There, we are slowly returning to the bullish side, and we can expect a breakthrough above today’s high. Potential higher targets are the $63500 and $64000 levels.


