Solana and Cardano: Cardano continues bullish option
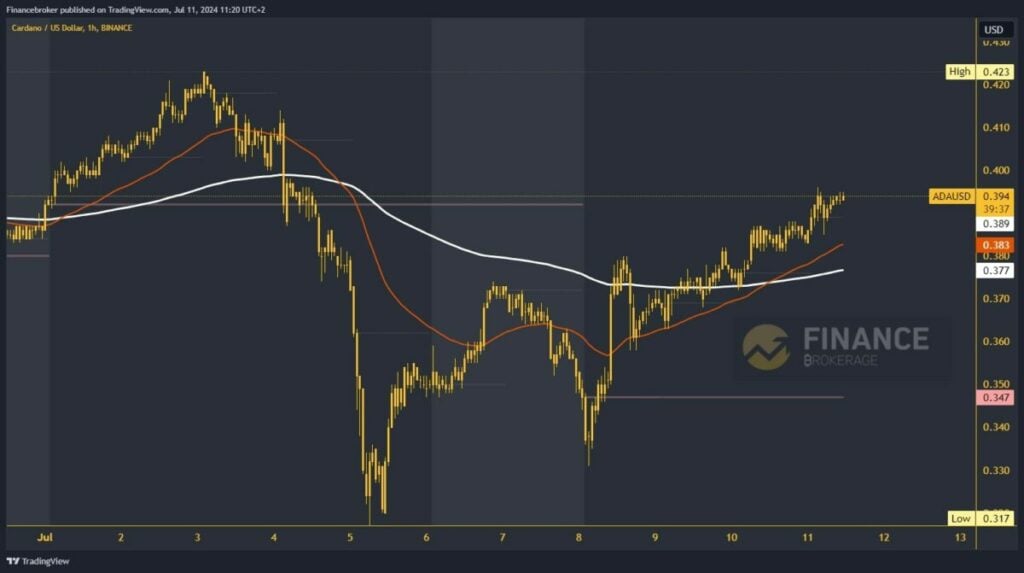
Cardano price rose to 0.395 this morning to a new weekly high.
Solana chart analysis
After yesterday’s jump in the price of Solana to $146.30, we were looking at a pullback to support at the $140.00 level. Additional support in this zone is the EMA 200 moving average. This morning, from that level, we initiated a new positive consolidation up to $143.00. We expect to move above $144.00 and form a new daily high. Potential higher targets are $146.00 and $148.00 levels.
For a bearish option, we need a negative consolidation and a return to the crucial $140.00 level. There, we will retest support at the EMA 200 moving average. With new pressure on that level, an impulse below to a new daily low could easily happen. Potential lower targets are the $138.00 and $136.00 levels.
Cardano chart analysis
Cardano price rose to 0.395 this morning to a new weekly high. This week, we are moving in a stable bullish consolidation with the support of the EMA 50 moving average. Everything indicates that we will see a further continuation to the bullish side. A break above 0.400 would be an excellent indicator of the start of a further recovery. Potential higher targets are 0.410 and 0.420 levels.
Last week’s high is at the 0.423 level. For a bearish option, we need the initiation of a bearish consolidation up to the 0.390 level. There, we will first test the daily open price. A break below pushes us to the negative side and reinforces the bearish momentum. After that, Cardano could just retreat and look for new support. Potential lower targets are the 0.380 and 0.370 levels. Additional support for the price could be the EMA 200 moving average in the zone of 0.380 levels.


