USDCHF and USDJPY: USDCHF fails to hold above 0.9000
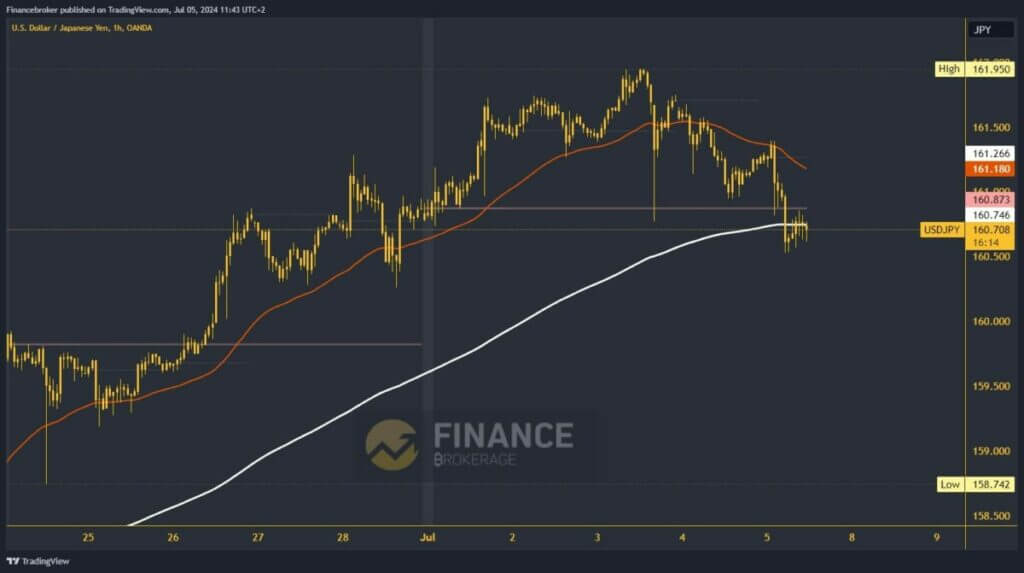
On Wednesday, USDJPY rose to 161.95, a new weekly high.
USDCHF chart analysis
During this morning’s Asian trading session, the USDCHF dipped below the EMA200 moving average. We were on the positive side until we encountered resistance at 0.90500 on Wednesday. After that, the pair goes down below the weekly open price, thus moving to the bearish side. Now, we are under a lot of pressure to start a further pullback and form a new weekly low. Potential lower targets are 0.89600 and 0.89400 levels.
For a bullish option, a positive consolidation and retracement above the 0.90000 level are essential. This move will bring us back above the EMA200 moving average to the positive side. Once we stabilize there, we can start building a position for a potential recovery. This strategy opens up the possibility of reaching the 0.90200 and 0.90400 levels, keeping us engaged in the process.
USDJPY chart analysis
On Wednesday, USDJPY rose to 161.95, a new weekly high. Soon after, the yen strengthens, and the pair begins to retreat. During this morning’s Asian trading session, we had resistance at the 161.30 level, from which we started to fall below the weekly open price and the EMA200 moving average. The pair is now under pressure to continue on the bearish side and look for new support at lower levels.
Potential lower targets are 160.50 and 160.00 levels. If we stabilize above the EMA200, USDJPY could then initiate a positive consolidation. New support and the formation of a higher low is a sign to return to the bullish side with the aim of climbing to a new high. Potential higher targets are 161.50 and 162.00 levels.


