Solana and Cardano: Cardano climbed to 0.410 level today
Cardano’s price is successfully recovering from the fall to 0.356 level.
Solana chart analysis
Last week, the price of Solana was forced down to the $122.18 level. After a short consolidation, a recovery from that level was initiated, and on Thursday, a new high was formed at the $151.15 level. After that, the price got tired of the rise and started a pullback. A new low was formed at the $137.50 level during the weekend. From there, the price moves with a bullish consolidation to the $145.00 level. Yesterday and today, the movement takes place in the $145.00-$149.00 range.
The current pressure is on the lower line, and we have the support of the EMA50 moving average. If it does not last, the next support is the EMA200 in the zone of $142.00 levels. Potential lower targets are $140.00 and $138.00 levels. We need an impulse above the $150.00 level for a bullish option. With this, we form a new weekly high and confirm that there is an increase in bullish momentum. Potential higher targets are $152.00 and $154.00 levels.
Cardano chart analysis
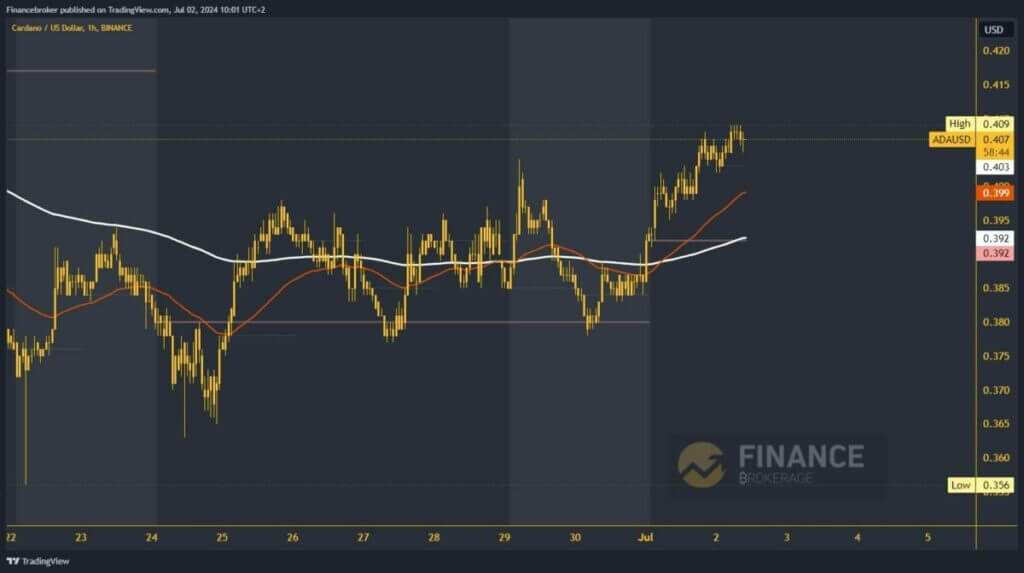
Cardano’s price is successfully recovering from the fall to 0.356 level. Last week, we saw a bullish consolidation and retracement above the EMA200 moving average. We continue on the bullish side this week and form a two-week high at the 0.409 level. Steady, bullish consolidation could push the price of Cardana to a new weekly high.
Potential higher targets are 0.415 and 0.420 levels. We need a negative consolidation and a price drop below the 0.400 level for a bearish option. With that step, we move away from the previous bullish path and move to the bearish side. Potential lower targets are 0.395 and 0.390 levels. Additional support is the EMA200 moving average in the weekly open price zone of 0.392.


