Oil and natural gas: oil in the zone is around $78.25
In the previous two days, the price of natural gas was in retreat.
Oil chart analysis
The price of oil rose to $79.35 on Wednesday. After forming a new weekly high in the previous two days, we are looking at a sideways consolidation movement in the $77.65-$79.00 range. In the previous few hours, the movement of oil was focused around the $78.20 level with the support of the EMA50 moving average. We expect a new bullish impulse and continued price growth to higher levels.
Potential higher targets are $78.50 and 79,004 levels. We need a negative consolidation and pullback to the $77.50 level for a bearish option. There, we will test the previous low. A break below forms a new daily low; thus, we get confirmation of bearish momentum. Potential lower targets are $77.00 and $76.50 levels. Additional new support is the EMA200 moving average in the $77.20 zone.
Natural gas chart analysis
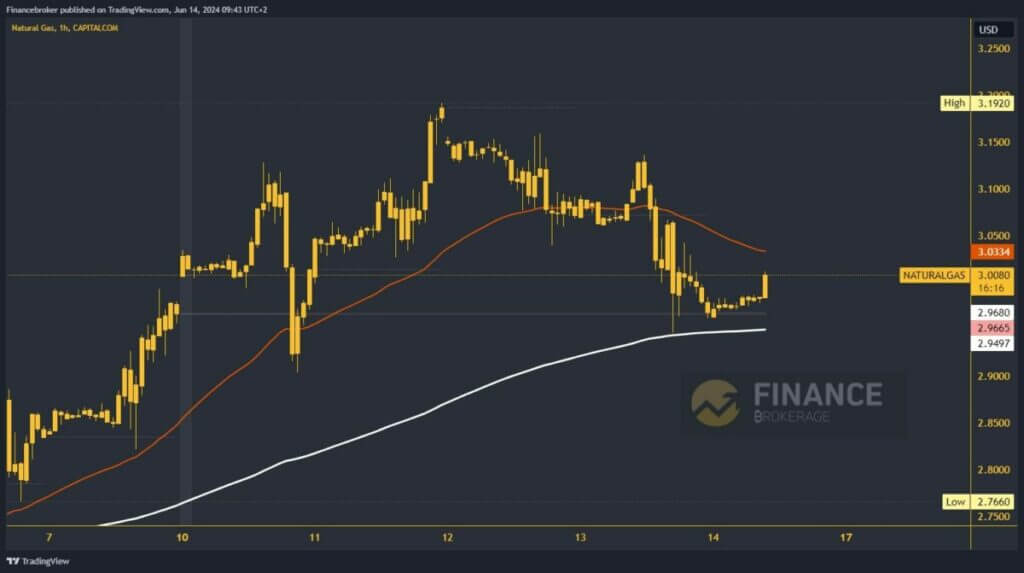
In the previous two days, the price of natural gas was in retreat. Yesterday we saw a drop to the $2.94 level and the EMA200 moving average. After that, we managed to hold on there and return to the $3.00 level this morning. Additional optimism is that the price remained on the positive side above the weekly open price. We see a bullish impulse in the current hour and expect a rise to $3.05 and the EMA50 moving average.
With the new support, natural gas could begin to recover more easily. Potential higher targets are $3.10 and $3.15 levels. We need a negative consolidation and a price drop below the $2.95 level for a bearish option. This puts pressure on the EMA200 and the weekly open price. A stronger impulse below would drop us to a new lower low and thus confirm the bearish momentum. Potential lower targets are $2.90 and $2.85 levels.


