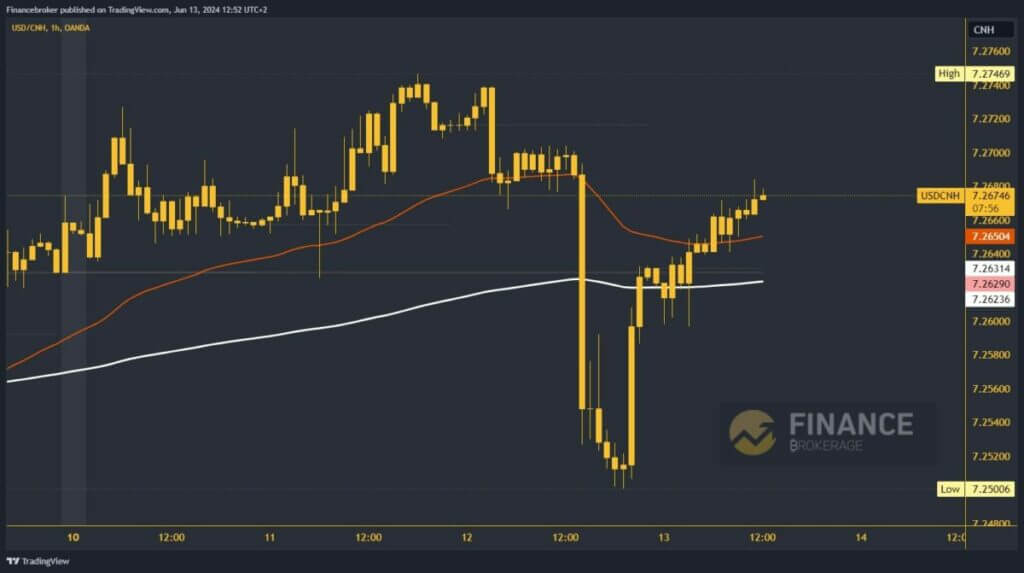
USDCAD and USDCNH: USDCNH fell to 7.25000 yesterday
A new weekly low for USDCNH was formed yesterday at the 7.25000 level.
USDCAD chart analysis
On Wednesday, USDCAD pulled back to support at the 1.36800 level. After a short consolidation in that zone, the pair starts with a bullish consolidation up to the 1.37300 level. During this morning’s Asian session, the recovery continued, and a daily high was formed at the 1.37500 level. A slight pullback pushes us to 1.37350, where we get support from the EMA50 moving average.
Now, we expect USDCAD to break the 1.37500 level and form a new daily high. Potential higher targets are 1.37600 and 1.37700 levels. We need a negative consolidation and pullback below the 1.37300 level for a bearish option. With that, we go down to new low days and increase bearish pressure on the pair. Potential lower targets are 1.37200 and 1.37100 levels.
USDCNH chart analysis
A new weekly low for USDCNH was formed yesterday at the 7.25000 level. After that, we saw a bullish impulse last night and a rise above 7.26400 and the EMA200 moving average. We are also back above the weekly open price on the positive side. During this morning’s Asian trading session, positive consolidation continued up to the 7.26850 level. If this consolidation takes place, the pair will climb to a new daily high.
Potential higher targets are 7.27000 and 7.27200 levels. We need a negative consolidation and a return down to the 7.26300 level for a bearish option. There, we will again test the support in the EMA200 and the weekly open price. The descent below pushes us to the negative side and thus confirms that there will be a further retreat of USDCNH to lower levels. Potential lower targets are 7.26000 and 7.25800 levels.


